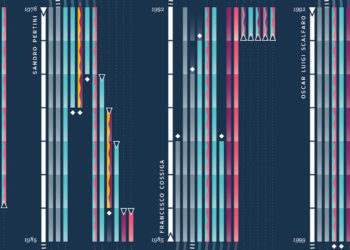
Data can be very powerful. If you can actually understand what it’s telling you, that is. It’s not easy to get clear takeaways by looking at some numbers and stats. You’ve got to have the data presented in a logical, easy-to-understand way.
With data visualization the human brain processes visual information better than it processes text – so by using charts, graphs, and design elements, data visualization can help you explain information much more easily.
