Videoanalyse Porsche 70 Jahre Jubiläum

Um weitere Daten zu bekommen die man dann auf verschiedene Videotypen verwerten kann, habe ich mich in diesem Beitrag mit dem folgenden Video genauer auseinandergesetzt und es mit Vineyards Filmbeschreibung kathegorisiert:

0:00 – 0:01 Fahrt mit gekippter Kamera

0:01-0:02 schwarze Blende

0:02-0:02 Textinsert auf neutralem Hintergrund

0:02-0:07 gestauchte Fahrt, Totale

0:07-0:11 Fahrt auf eine Person, Totale

0:11-0:14 Fahrt mit gekippter Kamera, Detailshot

0:14-0:16  gestauchte Fahrt mit Unschärfe und Dunkelheit, Totale

0:16- 0:21 gestauchte Fahrt, Totale

0:22-0:24 tiefe Fahrt, Detailshot

0:24-0:45 Zeitraffer Schnitte

0:45-0:48 Textinsert auf neutralem Hintergrund

0:48- 0:50 verlorene Fahrt, Halbe Höhe

0:50- 1:09 Zeitraffer Schnitte

1:09- 1:14 gestauchte Fahrt mit Auflösung in einem Detailshot

1:14-1:17 Mehrfacheinstellung

1:17-1:19 Zeitraffer Schnitte

1:19-1:20 Detailaufnahme

1:20-1:21 Amerikanische

1:21-1:22 Großaufnahme

1:22-1:23 Halbtotale

1:23-1:25 Sprungschnitte, Totale

1:25-1:33 Zeitraffer Schnitte

1:33-1:36    Fahrt auf eine Person, Auflösung in Nahaufnahme Übergang in Detailaufnahme

1:36-1:38 Totale

1:38-1:38 Detailaufnahme

1:39-1:39 Detailaufnahme

1:40-1:42 subjektiv bewegte Kamera

1:42-1:42 Detailaufnahme

1:43-1:48 Strungschnitte mit verschiedenen Perspektiven

1:49-1:52 tiefe Fahrt, Totale

1:52-1:52 Nahaufnahme

1:53-1:55 Totale

1:55-1:57 Detailaufnahme

1:57- 1:59 Totale

1:59 – 2:01 Nahaufnahme

2:01- 2:03 Textinsert auf neutralem Anfangsscreen

2:03- 2:04 gestauchte Fahrt, Nahaufnahme

2:05- 2:06 tiefe Fahrt

2:06-2:07 Nahaufnahme

2:08- 2:09 Nahaufnahme

2:09- 2:10 gestauchte Fahrt, Nahaufnahme

2:11- 2:12 gestauchte Fahrt, Nahaufnahme

2:12- 2:13 Halbtotale

2:13-2:13 Nahaufnahme

2:14-2:15 Ausdruckskamera

2:15- 2:16 Nahaufnahme

2:16-2:16 Nahaufnahme

2:17-2:17 gekippte Kamera, Nahaufnahme

2:17- 2:19 Überbelichtungsblende mit leichtem linksschwenk

2:19-2:20 Dramatischer Blickwinkel

2:20-2:21 Kranfahrt nach oben mit Totaler

2:21-2:22 Schärfeverlagerung auf Nahaufnahme

2:22- 2:23 Kameraschwenk nach rechts, Nahaufnahme

2:23-2:25 Amerikanische

2:25-2:26 Silhouette Kranfahrt nach oben

2:26-2:33 Luftaufnahme mit Zoom out der zum Logo wird
Mobile App Design: Creating Visual Structure

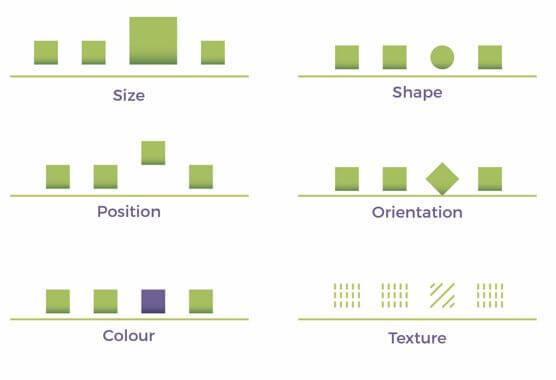
When the information architecture is in place you will gradually start with the visualisation process. The information architecture tells you where to put your information and how it is connected to but not how it is visualized in a way that the user can understand the connections. At this point, creating a visual hierarchy is important. You can create visual structure with different shapes, sizes, textures etc. (see below)

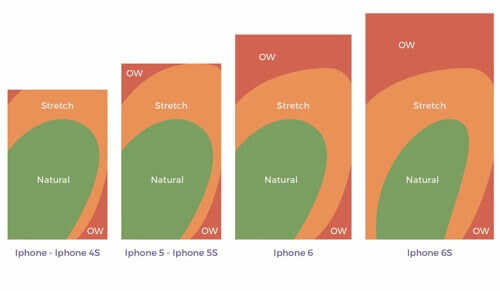
Most mobile applications will have buttons that need to be touched so that the user can interact properly with the data. Therefore, the size of buttons should be suited for touch and they should ideally be positioned in the lower half of the screen due to the increasing size of smartphone displays. (see below)

When you are creating a visual structure for your application, you should also write a style-guide that encompasses the colours you are using, details about the font you are using and how design elements are used correctly.

Sources:

https://uxstudioteam.com/ux-blog/screen-design/
https://www.springboard.com/blog/ux-design-principles/

Choosing Digital

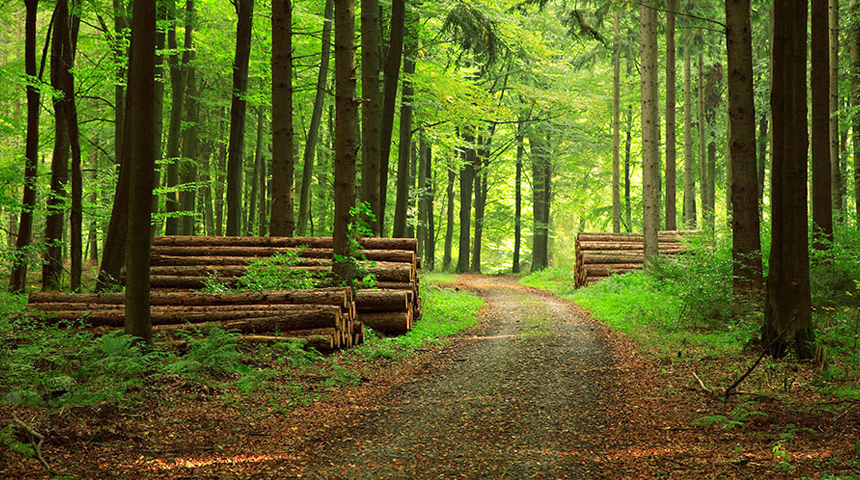
Around 410 million tons of paper and cardboard are produced and consumed worldwide each year. The per capita consumption in Austria is around 218 kilos per year – that is approx. 4.2 kilos a week. This amount is about four times the global average (56.5 kilos). In the USA the consumption is 219 kilos, the European average is158 kilos and in Africa it is only 7.7 kilos per capita. Austria is thus one of the frontrunners in paper consumption, the EU and the US together consume around 37% of the world’s paper production.

Forests are not only the “lungs of the world” (they bind CO2 and release oxygen) and home to two thirds of all animal and plant species, they are also pollutant filters, regulate the water balance and stabilize the earth’s climate. The paper industry is the world’s fifth largest energy consumer, which needs more water than any other industry and threatens the livelihood of people and animals with its hunger for resources. 20 football fields disappear every minute and 40% of industrial forestry goes to the paper industry.

In recent years the smartphone has become a loyal companion in everyday life with increasing functionality. By 2014 most people in the industrialised world had a smartphone with the ability to download data depending on their needs. Since then print media have become obsolete in their use, because the fast-paced world of today is in need of a medium that transfers information worldwide within seconds and this information can be updated at any given moment. A mobile application, which makes use of the internet, is a powerful medium that can be used to transfer information instantaneously and it is also a viable antidote to deforestation for paper production.

Sources:

https://www.umweltberatung.at/papierverbrauch-steigt-weiter-an
https://de.statista.com/statistik/daten/studie/483406/umfrage/kohlendioxid-emissionen-bei-der-herstellung-von-papier-und-pappe-in-deutschland/
https://www.kartenmacherei.de/digitalisierung-in-der-familie/#kinder

The history of the nonlinear story part 2

While in the decades before, the amount of movies which used the nonlinear narrative method in them were around ten, in the second half of the 1990’s there were about 10 each year. This  was probably the outcome of the success of few nonlinear movies in the first half of the 90’s such as “reservoir dogs”, “forrest gump”,” pulp fiction”, “natural born killers” and the “usual suspects”, which all won prizes and were successful in the box offices as well. 

The second half of the 90s introduced us to few other known films in which the same method was used in them such as “the english patient, “magnolia” and “titanic”. 

Coming into the 21 century the  nonlinear narration became a very frequent method, in movies as well as on television. Between 2000 and 2009, a lot of very well known and memorable movies came out such as  “memento”, “city of god”, “vanilla sky”, “kill bill” and many more others. 

Since 2010 there has been a decline in the usage of the nonlinear narration method in movies but a significant increase in the television content. Between 2000 and 2009 there were about 12 different tv series aired in HBO, ABC, BBC and NETFLIX while between 2010 and 2017 more than 60. 

It seems that just like most of the film industry is moving to the smaller screen the nonlinear method is as well.