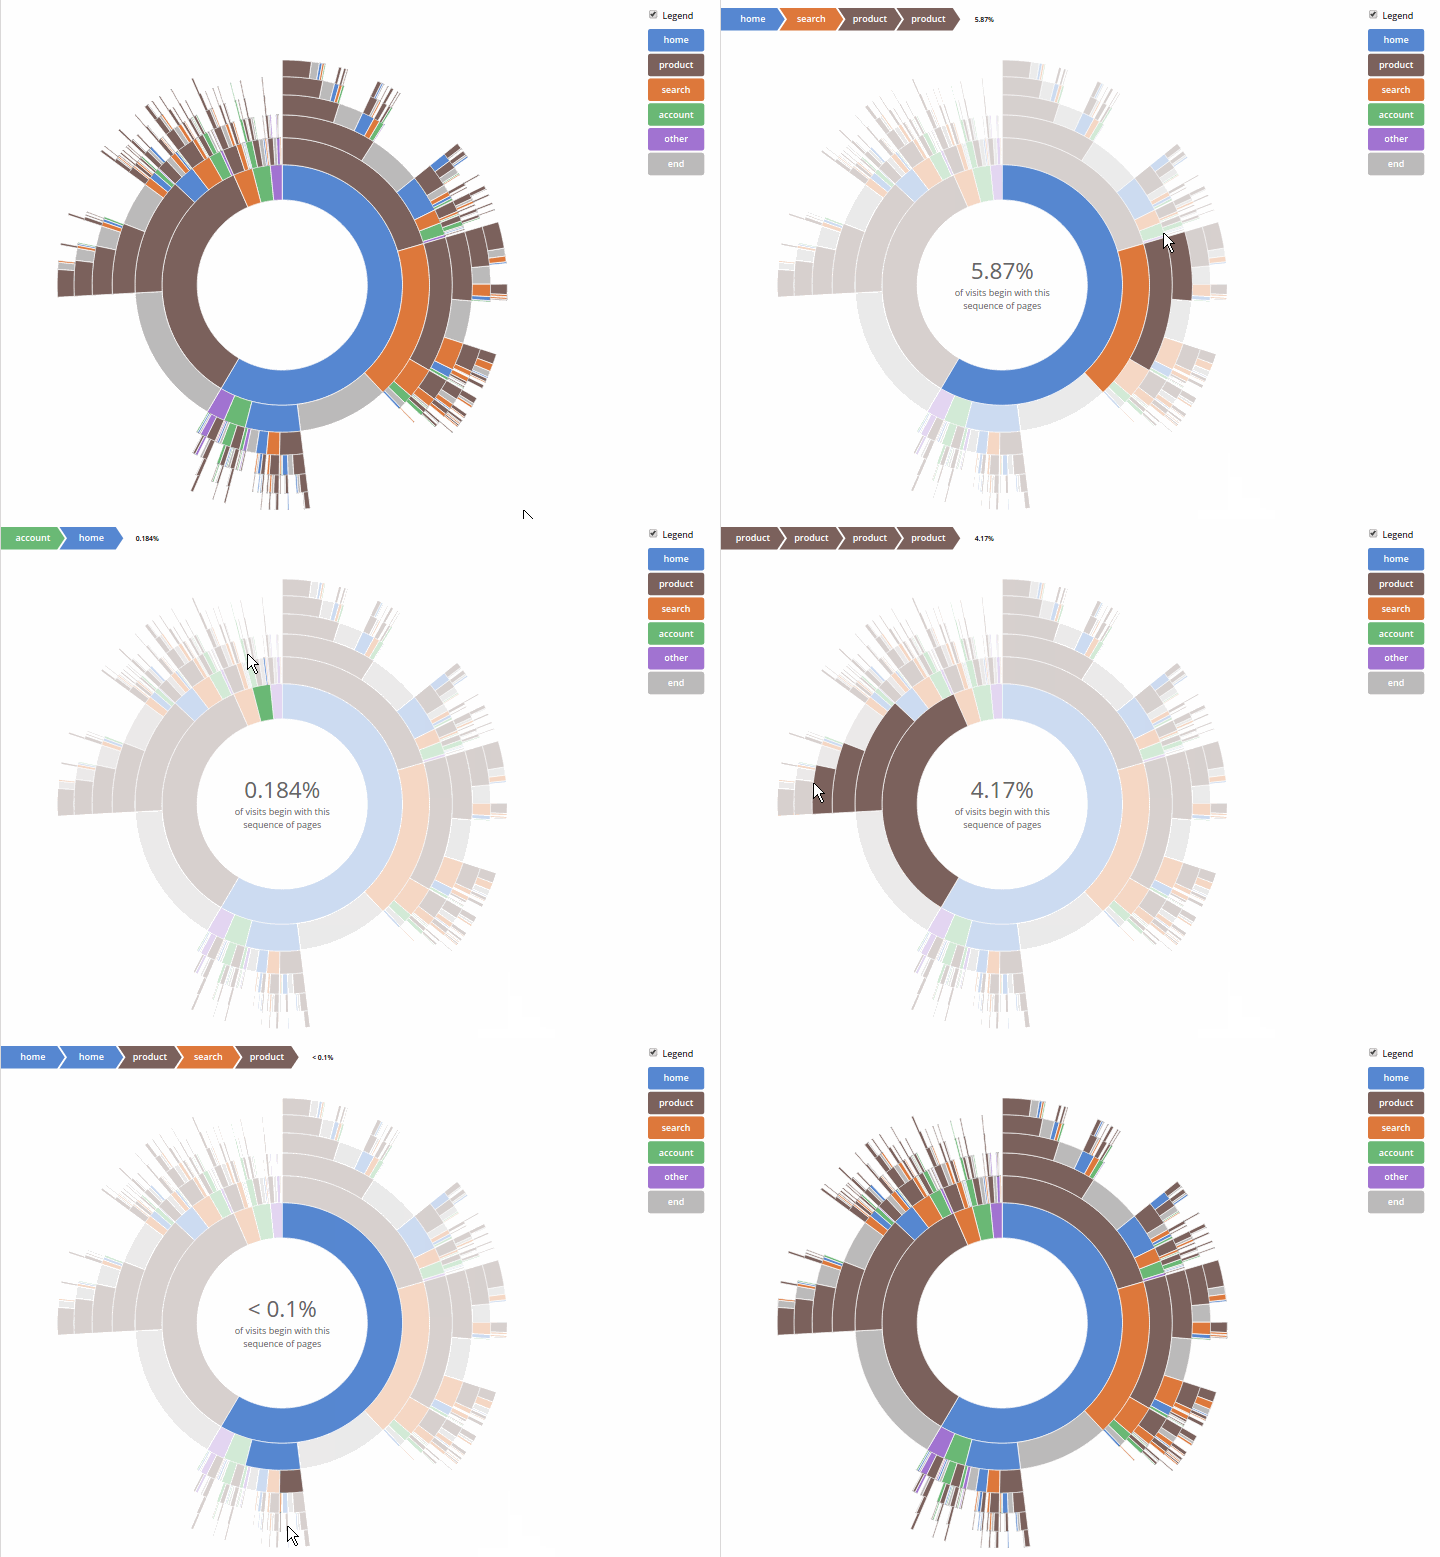
We live in an era of data explosion, where nearly every application/website uses data to improve the experience delivered to the users.
Sometimes, the best feature is the data itself. However, table and number charts are often hard to read and it can be hard to draw insights from large data tables.
Instead different data visualization methods can be used that simulate the brain’s ability to process data in a visual way.
In my research I found different Javascript Libraries that could help to make data interactive.
D3js

D3.js is probably the most popular and extensive Javascript data visualization library out there. D3 is built for manipulating documents based on data and bring data to life using HTML, SVG, and CSS.
ChartJS

A popular library of open source HTML 5 charts for responsive web applications using the canvas element. Designs are simple and elegant with 8 different chart types
React-vis

React-vis is Uber’s set of components for visualizing data in a consistent way, including line/area/bar charts, heat maps, scatterplots, contour plots, hexagon heatmaps and much more.
Raw graphs

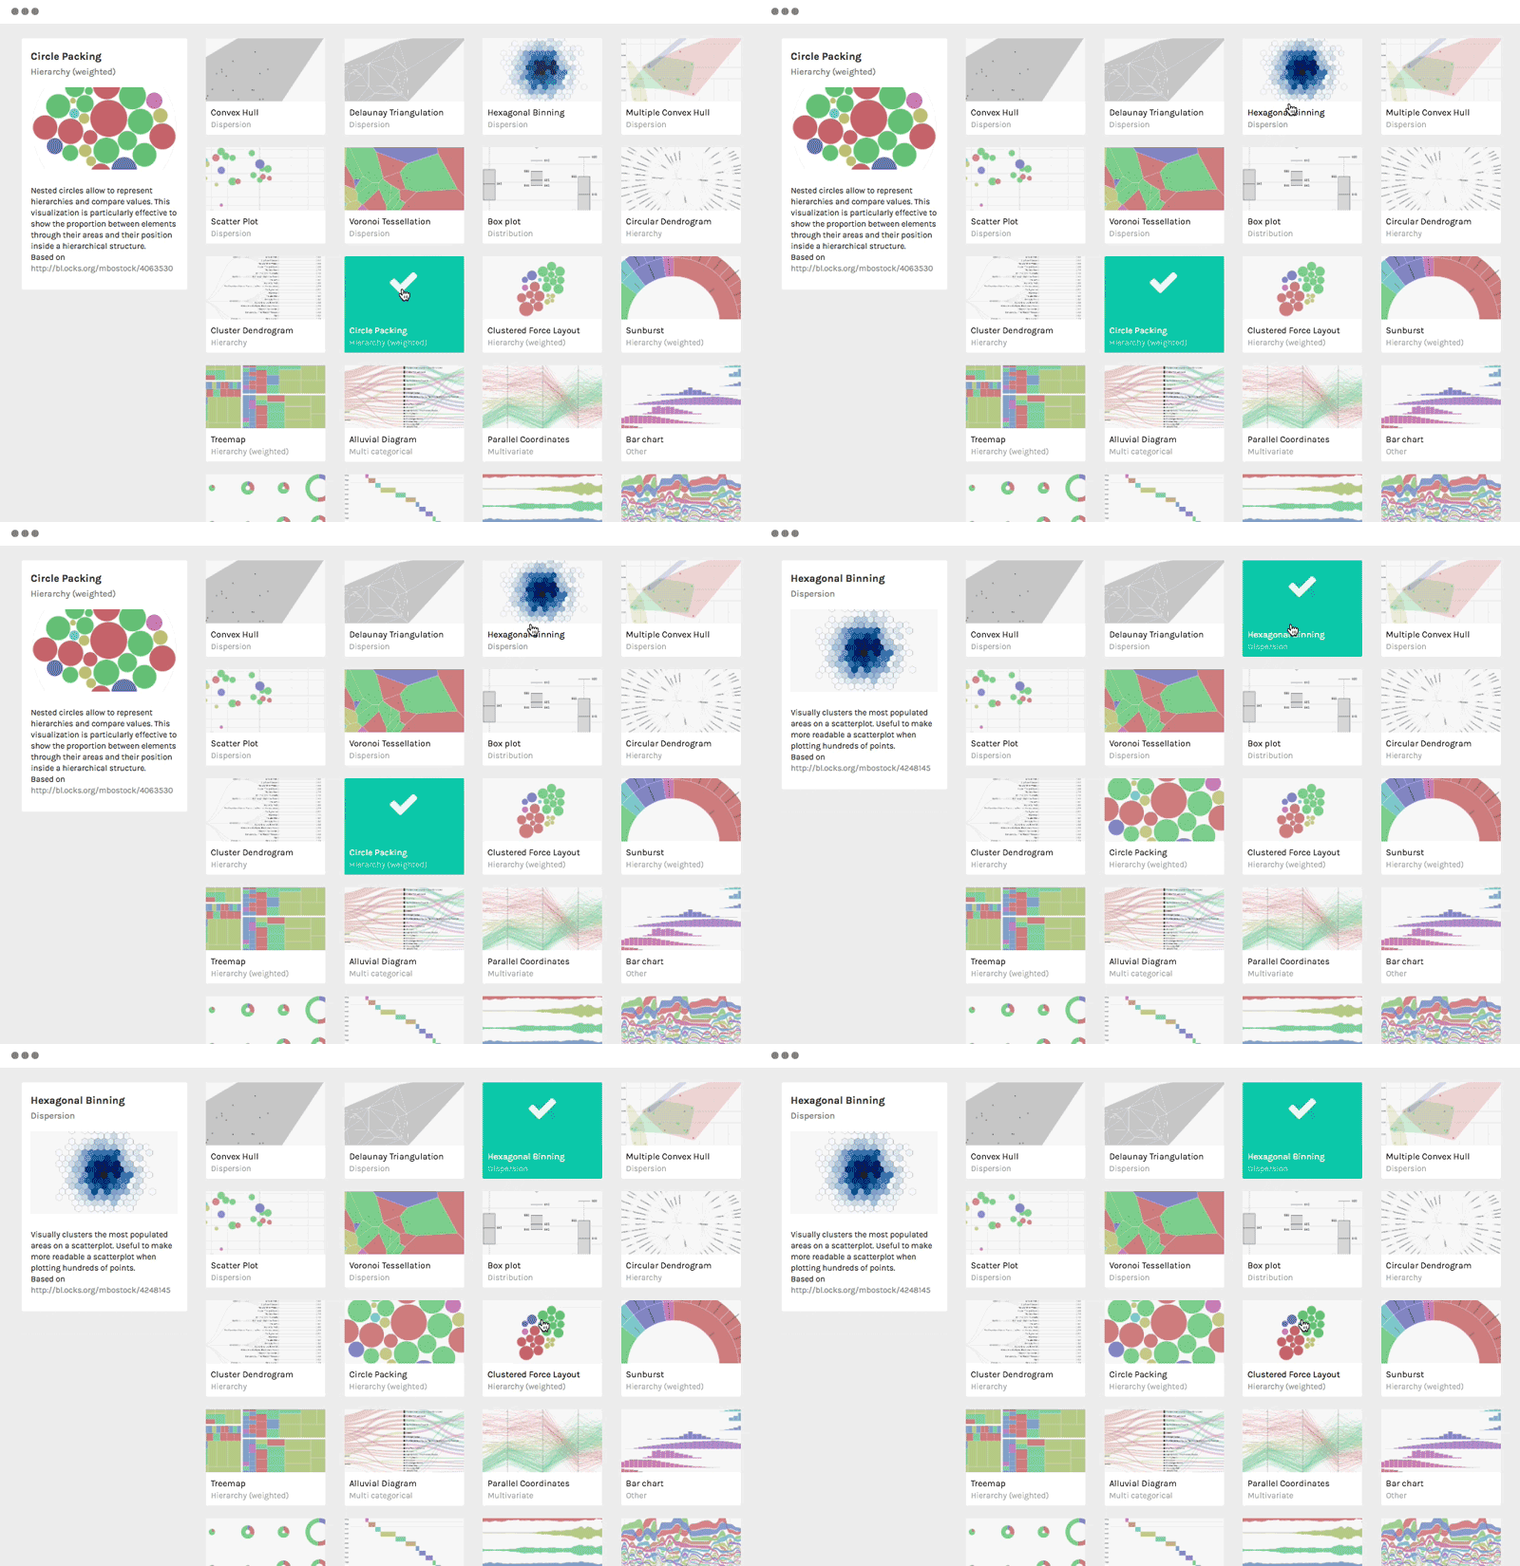
Raw graphs is a connection between spreadsheets and data visualization build for the d3.js library. It works with tabular data (spreadhseets and comma-separated values) as well as with copied-and-pasted texts from other applications.
Conclusion
After comparing different data visualization javascript librarys I’ll try and buil my own interactive data vizualization with the d3.js library in combination with Raw graphs.